|
|
|
|

|
Content
|
2. Blog article: EXCELLERAT at OpenFOAM Workshop
|
|
3. Blog article: Removing the warm up period from the output of a time-dependent simulation
|
|
|
|
|
|
1. Welcome
|
We trust you had an enjoyable summer break and are geared up for EXCELLERAT updates.In this edition of our newsletter, we present you with our latest blog articles, offering knowledge and insights into cutting-edge topics. Additionally, we would like to provide you with a sneak peek into our upcoming training events, designed to empower you with valuable skills and expertise.
|
We hope you enjoy reading our newsletter. As always, stay connected with us to stay informed about our continuous progress and innovation!
|
|
EXCELLERAT P2 Project Coordinator
|
|
|
|
2. Blog article: EXCELLERAT at OpenFOAM Workshop
|
|
|
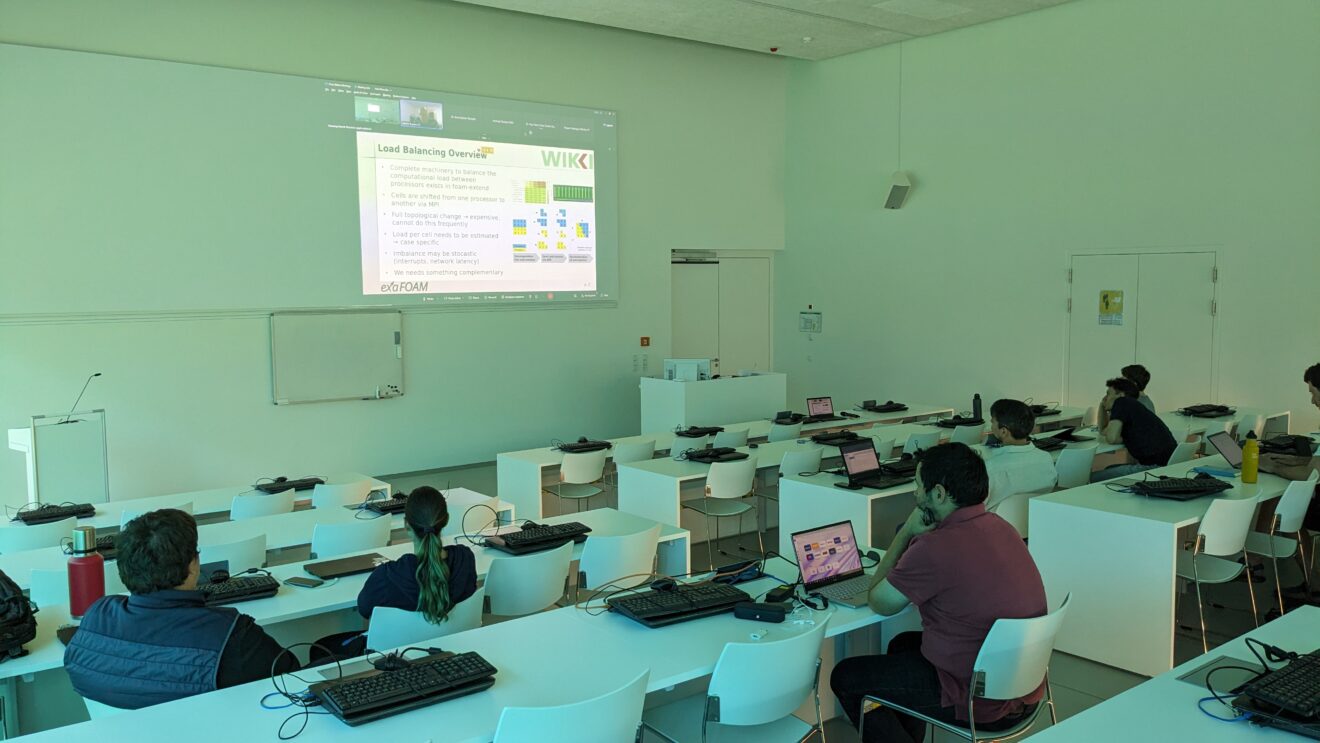
Alongside other projects EXCELLERAT 2 was part of the Joint Workshop on the 4th and 5th September to push forward OpenFOAM. EXCELLERAT 2 was represented by Dennis Grieger from HLRS. He gave insights into in situ visualisation. Learn more in a recent blog article.
|
|
3. Blog article: Removing the warm up period from the output of a time-dependent simulation
|
|
How does one detect the warm up period in a simulation? In our latest blog article, a practical method is being explained, with code snippets in Python.
|
|
|
|
4. Further news & events
|
We have launched a YouTube channel – subscribe for multimedia updates.
|
|
Training course: Scientific Visualization with COVISE and Vistle
|
|
(9-10 October 2023, HLRS in Stuttgart, Germany)
|
This on-site course is targeted at researchers with basic knowledge in numerical simulation, who would like to learn how to visualize their simulation results on the desktop but also in Augmented Reality and Virtual Environments. The two-day workshop gives a short overview over scientific visualization in general, followed by a hands-on introduction to 3D desktop visualization with VISTLE and COVISE. Participants will further learn how to build interactive 3D Models for Virtual Environments and how to set up an Augmented Reality visualization. Register now
|
|
Self-paced course: Approaches to analysing time-series data
|
|
Tourist destination managers, service providers, and researchers want to better understand traffic flows: what impact traffic flows have, when do traffic peaks occur, what are the seasonal effects, which areas are more / less congested with tourists, how do weather, holidays and other events affect this behaviour. With the help of data analysis and forecasts, they can prepare for periods of increased visits, as well as adjust marketing activities, service offerings, or resources allocation. In this tutorial we look at a real-world dataset consisting of traffic counters on Slovenian roads, provided by the Slovenian Road Network (DARS), and its application to the questions above. Get access to the tutorial through our Service Portal.
|
|
|
|
|
|

|
|
Funded by the European Union. This work has received funding from the European High Performance Computing Joint Undertaking (JU) and Germany, Italy, Slovenia, Spain, Sweden, and France under grant agreement No 101092621.
|
Höchstleistungsrechenzentrum Stuttgart (HLRS) | Nobelstraße 19
|
|
70569 Stuttgart | Germany
|
|
|
|
|
|
|